Understanding Your Electricity Bill: What You’re Really Paying For
You open your electricity bill. The number on the front page makes your stomach drop. You think, “How on earth am I using that much power?” When you try to dig into the details, it’s a wall of jargon. Supply charges, time-of-use rates, controlled loads, kilowatt-hours — and then there’s a mystery credit you didn’t expect. It’s hard to tell what you’re actually paying for, let alone whether it’s fair.
To make things worse? Rates have quietly gone up — again. There’s no big announcement, no warning, just a higher price per kilowatt-hour tucked away in the fine print. You feel like you’re being charged more and getting less, without really knowing why.
You’re not alone. Electricity bills are designed to show the information — not explain it. For those who have added solar, it often introduces another layer of complexity to the bill.
At Lenergy, we speak to homeowners every week who are paying too much, not just because they use too much power — but because they don’t fully understand what they’re being charged for, or how to check it. Often, they’ve already taken steps to reduce usage or install solar, yet they still feel like they’re still paying more than they expected.
In this guide, you’ll learn how to read your electricity bill with confidence.
We’ll show you exactly what to look for — step by step — with visual examples to help you follow along. Whether you have solar or not, you’ll understand what each charge means, why your bill fluctuates across the year, and how to spot red flags — such as sneaky rate increases.
- Why Electricity Bills Feel So Confusing
- What to Look for When You Open Your Bill
- Breaking Down the Metrics: What You’re Actually Being Charged For
- How Solar Affects Your Bill (And What to Watch Out For)
- Why Your Bill Changes With the Seasons
- Monthly vs Quarterly Billing — Why It Matters
- How to Spot Problems or Overcharging
- Make Your Electricity Bill Work for You
Why Electricity Bills Feel So Confusing
Most electricity bills are designed for accountants, not everyday homeowners. They’re packed with technical terms, hard-to-follow tables, and totals that don’t tell the full story. Even if your usage is consistent, your bill can still go up — and you’re left wondering what changed.
A big part of the confusion comes from how energy is priced. You’re not just paying for how much electricity you use. You’re also paying:
- A daily supply charge just to be connected to the grid
- Different usage rates depending on when you use power (peak, off-peak, shoulder)
- Extra costs or credits if you have solar
- And sometimes, sudden rate increases that aren’t clearly flagged
Then there’s the issue of how you pay. Many households are on weekly or fortnightly direct debits — and while this can make bills feel more manageable, it can also mask how much you’re actually spending. The payments feel small, but the total across a billing cycle (especially quarterly ones) can be surprisingly high.
It’s no wonder people look at the “Amount Due” on the front page and feel blindsided. It might include weeks of backdated charges or spread across a long billing period. If you’re not tracking your usage or the rising rates underneath, it’s easy to miss the bigger picture.
If you’ve ever thought, “My usage hasn’t changed, but my bill has,” — this section will explain why.
What to Look for When You Open Your Bill
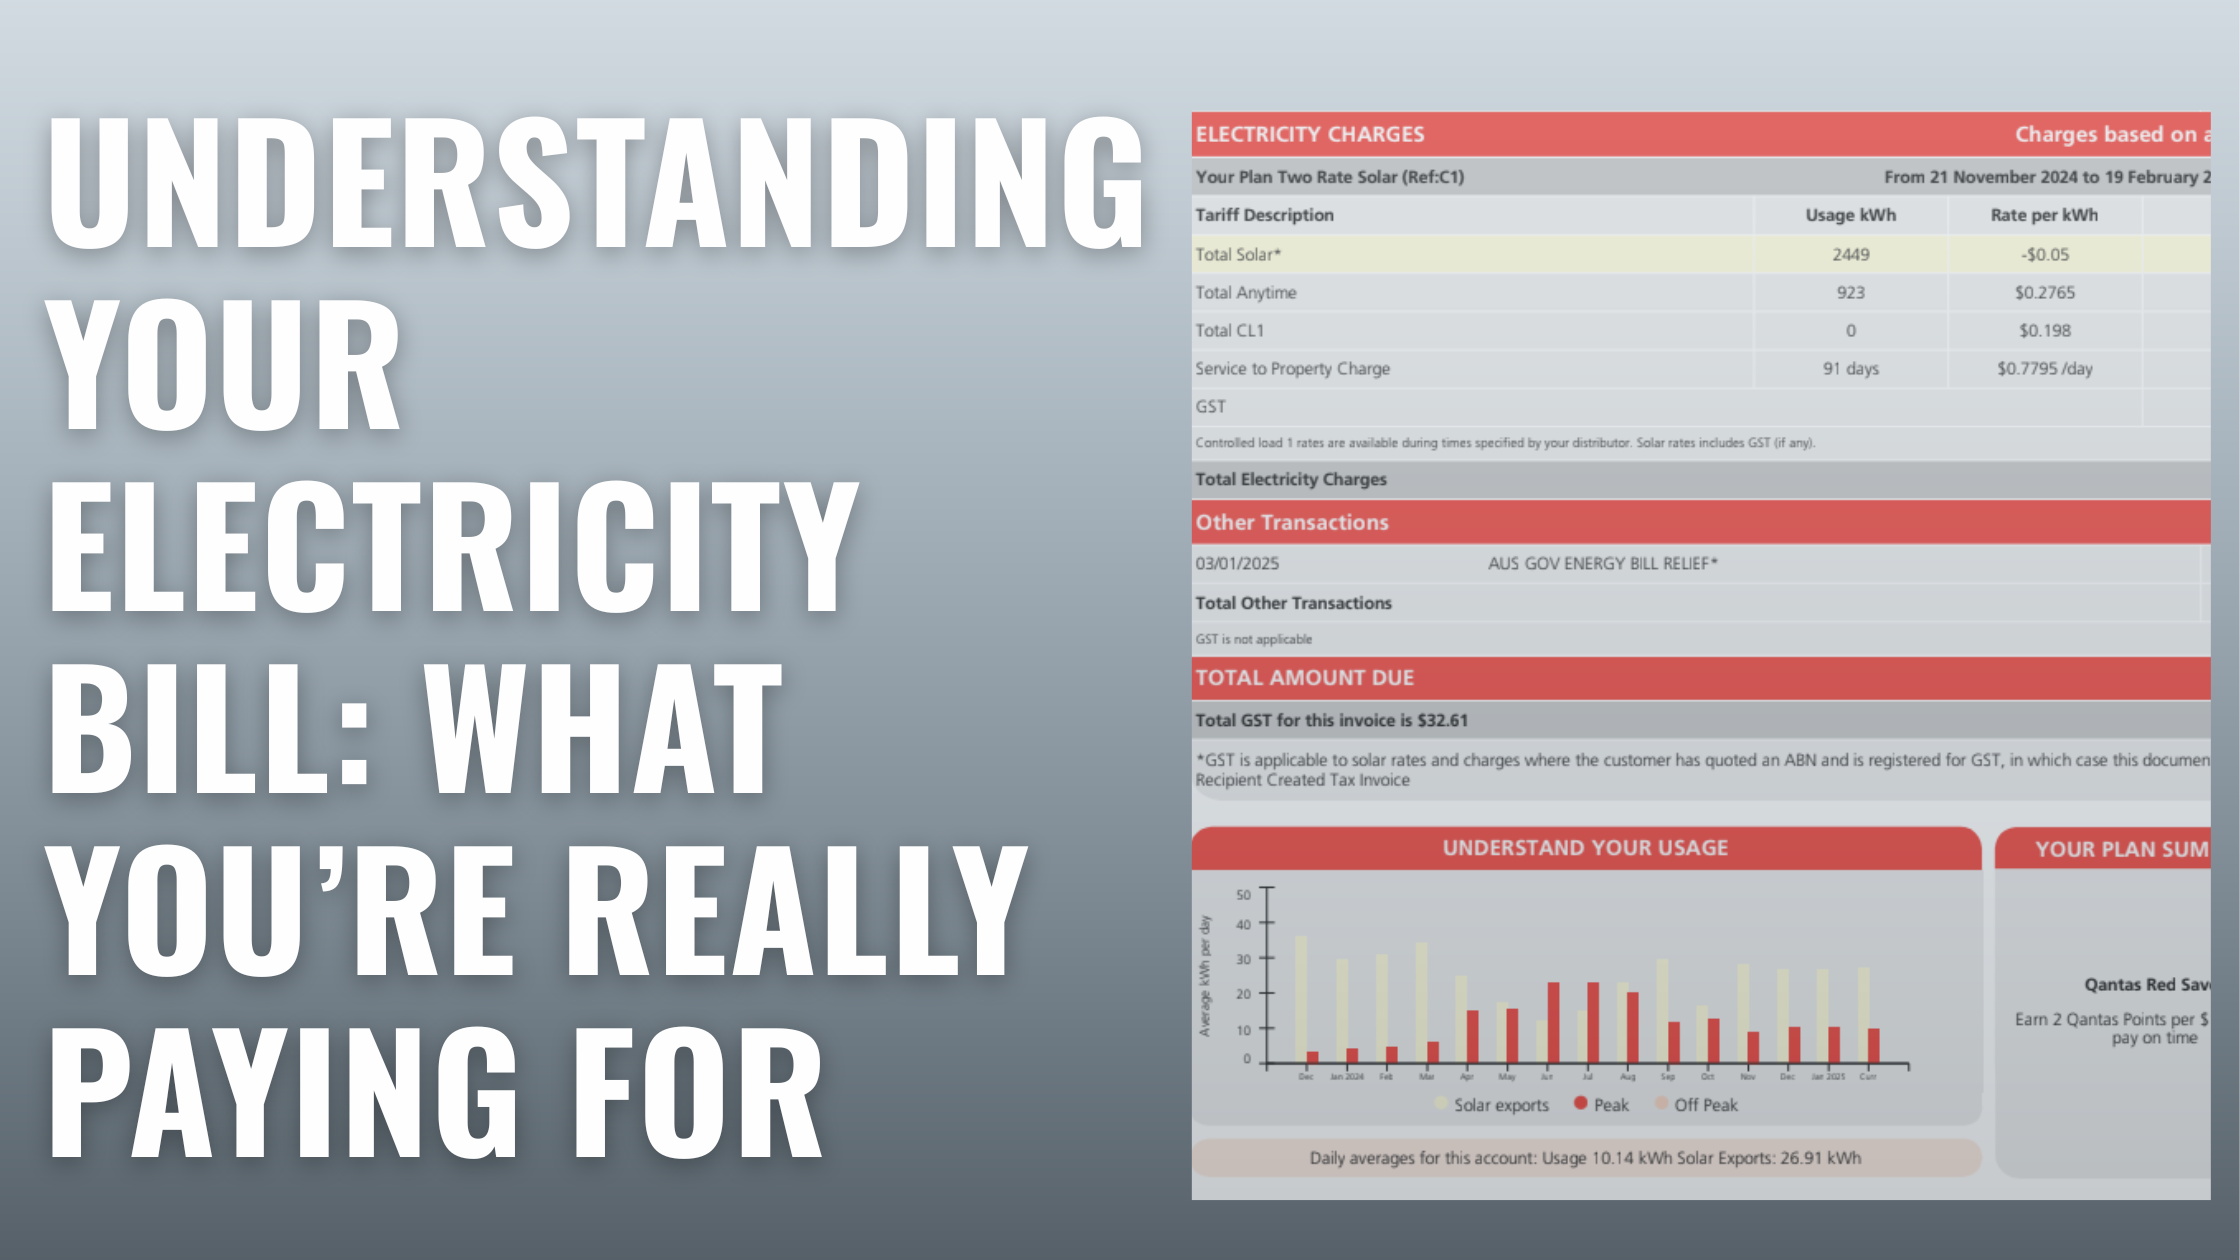
Before you start scanning rows of numbers or wondering what a kilowatt-hour actually costs — pause. The most useful thing you can do with your electricity bill is to start with four key metrics. These tell you how your charges are calculated, how long they cover, and whether anything looks off.
Here’s what to look for:
Billing Period
This tells you the exact dates the bill covers. Some people get billed monthly, others quarterly. If you don’t notice this upfront, it’s easy to misjudge how high your bill really is.
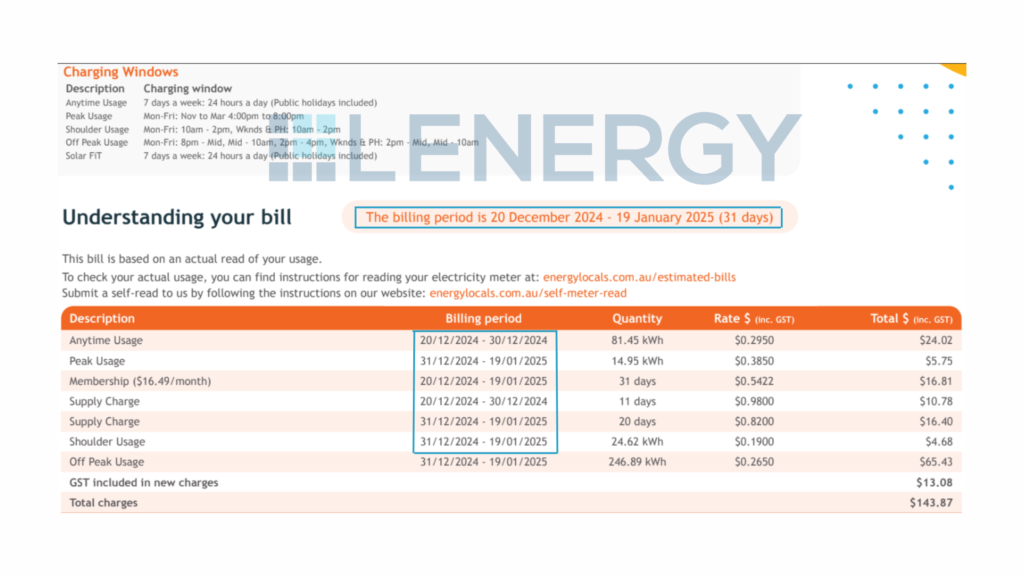
Always double-check how many days your bill is spread across. A $500 bill might seem massive — until you realise it’s covering 90 days, not 30.
Average Daily Usage
This shows how much electricity you use on an average day, usually in kilowatt-hours (kWh). It’s one of the easiest ways to track whether your usage is changing — especially useful across seasons.
Compare this to your past bills to spot trends. Some retailers also compare your usage to “similar homes” — which can be helpful, but take it with a grain of salt.
Usage Rates
You might be paying different rates for electricity depending on when you use it:
- Flat rate: One rate for all hours
- Time-of-use (TOU): Higher rates during peak hours, lower off-peak
- Shoulder rates: Mid-tier pricing between peak and off-peak periods
- Controlled load: A separate rate for specific appliances like electric hot water systems, usually at night
Understanding your rates helps you match your habits. If you’re on TOU pricing and running appliances during peak times, your costs can climb quickly — even if your usage is low. Knowing when shoulder and off-peak periods apply can help you shift usage and save.
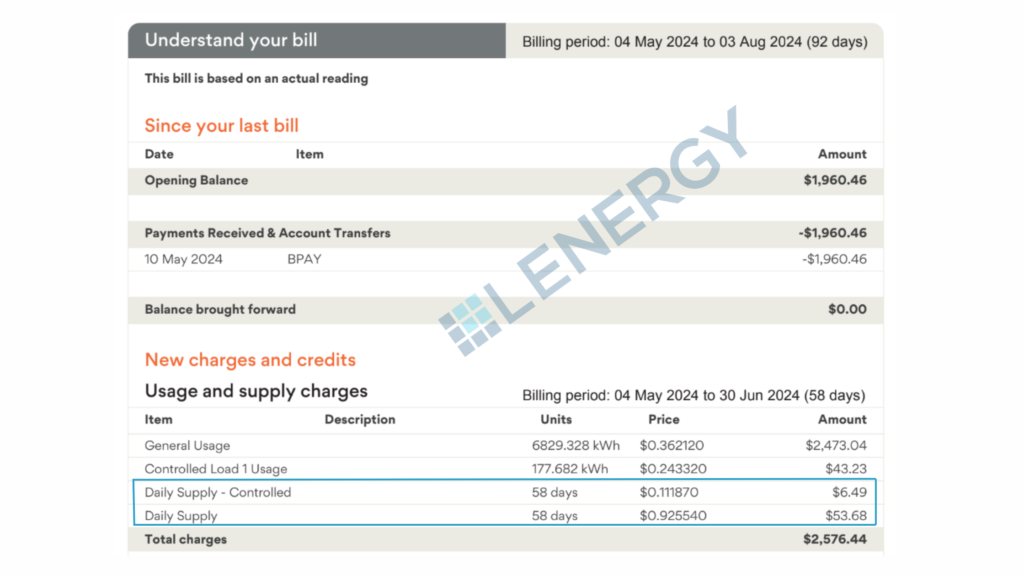
Daily Supply Charge
This is a fixed amount you pay every day just to be connected to the grid — even if you use no electricity at all.
It’s usually listed separately to usage rates and often surprises people. Multiply it by the number of days in your billing period to see how much it really adds up to.
Learning to spot these four things takes just a minute — but it gives you a clearer picture of what you’re really paying for.
Breaking Down the Metrics: What You’re Actually Being Charged For
Once you’ve found the basics — billing period, usage, supply charge, and rates — the next step is understanding what all those line items on your bill actually mean. This section gives you a simple breakdown of the most common charges and credits you’ll see.
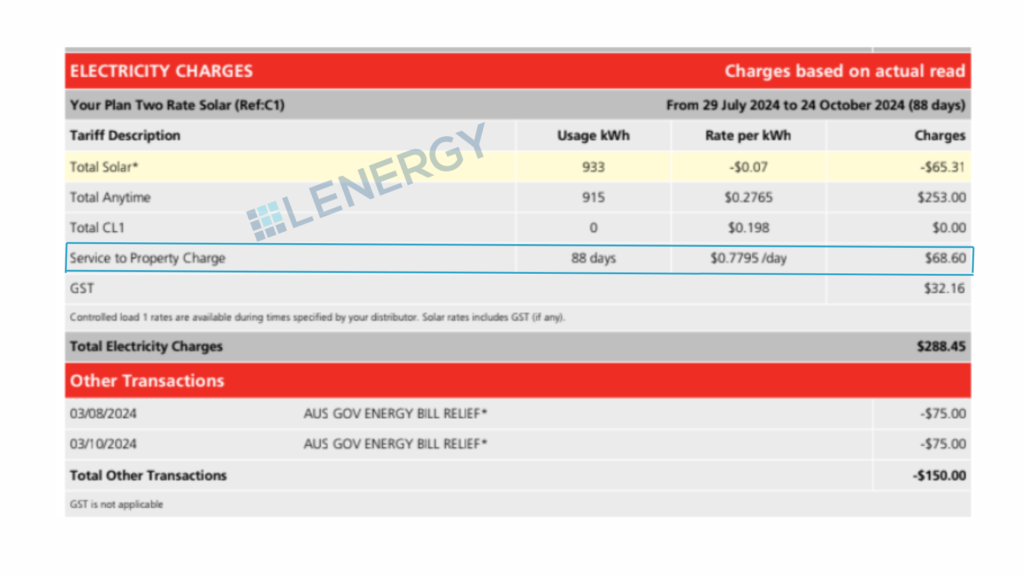
Daily Supply Charge
This is a fixed fee just for being connected to the electricity grid — it’s charged per day, no matter how much or how little power you use. It usually ranges from 90 cents to $1.30 per day depending on your plan and provider.
If your bill covers 90 days, and your supply charge is $1.10/day, that is adding $99 in connection fees alone to your bill — before accounting for a single kilowatt-hour of energy.
Some plans — especially controlled load and time-of-use (TOU) tariffs — may include additional daily supply charges for each metering configuration. For example:
- If you have a controlled load for your electric hot water system, you might see a second supply charge just for that meter.
- Some TOU plans may break out supply charges per rate type or meter, depending on your setup.
This means your fixed daily charges could include two or even three separate daily supply fees — and they all add up.
Usage Charges
This is the part of your bill based on how much electricity you actually use, measured in kilowatt-hours (kWh). You might see one flat rate, or several rates depending on your pricing structure:
- Peak rate: Highest rate, usually weekday afternoons and evenings (e.g. 4–9 pm)
- Shoulder rate: Moderate pricing, often mornings or mid-day periods
- Off-peak rate: Cheapest rate, usually overnight or weekends.
Some providers are now introducing midday off-peak rates due to high levels of solar generation feeding into the grid. This reflects a broader shift in how energy is priced — and new options like solar sharing schemes are also starting to emerge.
You can read more about that here. - Controlled load: A lower rate for specific appliances like electric hot water systems, usually metered separately and run at off-peak times.
Understanding how your rates work helps you make smarter choices about when to run power-hungry appliances — and can help you avoid using electricity during the most expensive times of day.
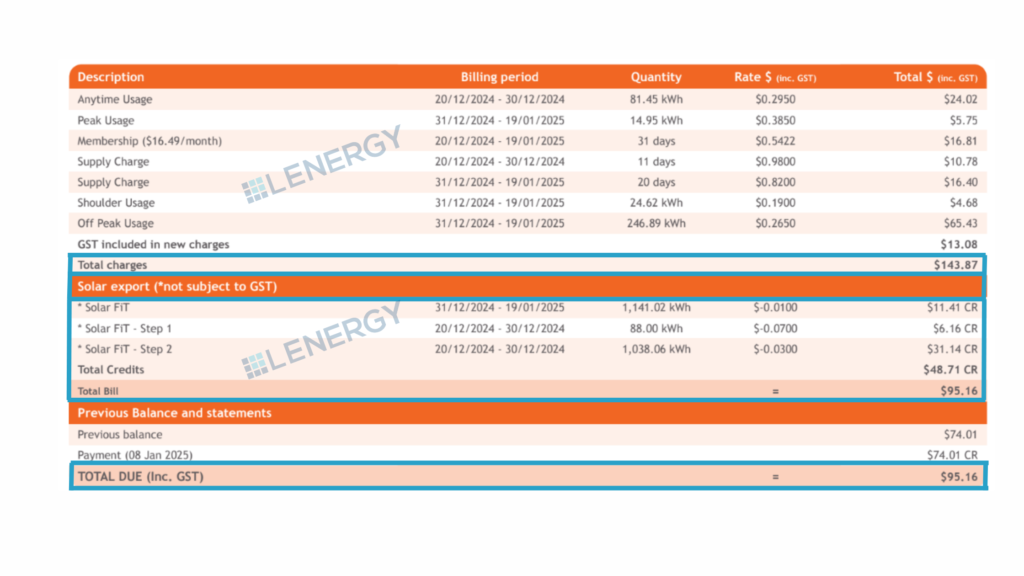
Solar Feed-in Credits (for solar households)
If you have solar panels, any excess power your system exports to the grid is credited to your bill at a “feed-in tariff” — usually between 0 and 7 cents per kWh.
This will appear as a line item or section on your bill, often labelled “solar export” or “feed-in credit.” It’s subtracted from your total charges, not paid out in cash unless you’re in credit.
It’s important to note: just having solar doesn’t mean your bill will be zero. You still pay for any grid power you use outside solar hours — and your daily supply charge still applies.
Other Items You Might See
Depending on your provider and plan, you might also notice:
- GreenPower charges (if you’ve opted in to pay for renewable energy)
- Metering fees (for remotely read smart meters)
- Credit adjustments or late payment fees
- Government rebates or concessions, if applicable
Each of these should be listed with clear labels — but unfortunately, that’s not always the case.
How Solar Affects Your Bill (And What to Watch Out For)
If you’ve installed solar panels, you probably expected a sharp drop in your power bills — maybe even a $0 balance. However, for many households, the first post-solar bill brings a surprise: you’re still paying more than expected. Here’s why that happens, and how to read your bill correctly with solar in the mix.
You Still Use Grid Power — Just Not as Much
Your solar system generates power during the day, and when you’re using electricity at the same time, your home will use that solar power first. This is where most solar savings actually come from — because you’re avoiding buying electricity from the grid at full retail prices.
However, your electricity bill does not show this self-consumed solar energy. The bill only records what passes through the meter:
- Electricity you import from the grid
- Electricity you export back to the grid
So while your solar system may be powering much of your home during the day, that benefit happens “behind the meter” and isn’t visible as a line item. The charges you see are simply the remaining gap — the grid power you still need at night, during poor weather, or during high-usage periods.
Feed-in Tariffs Don’t Show the Full Picture
Any unused solar energy is exported to the grid and credited at a feed-in tariff (FiT). These rates are typically much lower than what you pay to buy electricity — often around 0–7 cents per kWh compared to 30–50 cents per kWh for usage charges.
Because your bill only shows exports, it can make solar look less effective than it really is. Even if your feed-in credit seems small, that doesn’t mean your system isn’t saving you money. It means the self-consumed solar energy — the portion you used directly in your home — isn’t measured by the meter and therefore doesn’t appear on your bill.
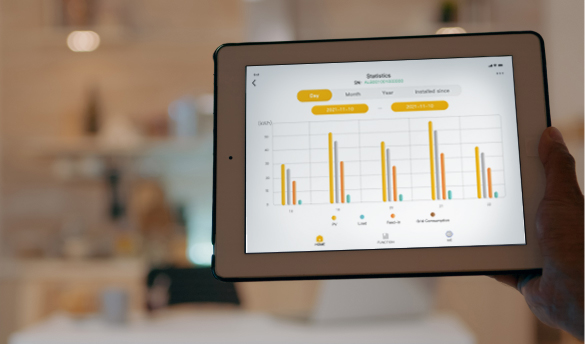
This is why a single electricity bill often understates the real financial benefit of solar. For a more accurate understanding of how your solar is saving you money depending on the system you have you can refer to your solar tracking app such as the mySigen App, or setup your AlphaCloud app. These will give you a full breakdown of how your Solar + Battery system is powering your home.
You Still Pay the Daily Supply Charge
Even if you export more electricity than you import, you’ll still be charged daily supply fees — and if you’re on a time-of-use or controlled load plan, there might be more than one. In some cases, the supply charge alone can account for a third (or more) of your total bill.
Billing Mistakes with Solar Are Common
Not all electricity retailers handle solar exports accurately. If something looks off — for example, if your feed-in credits seem unusually low, or your export figures are missing altogether — it’s worth checking:
- Your inverter’s export data
- Your smart meter reads (if accessible)
- Whether your FiT rate matches what your plan promised
Errors do happen, especially if your meter wasn’t properly reconfigured after installation.
Solar is a great investment, but it doesn’t eliminate your bill entirely — especially without a battery. The key is understanding how your solar generation and feed-in credits appear on the bill, and recognising that most of your savings are happening quietly in the background, powering your home without ever being recorded.
Why Your Bill Changes With the Seasons
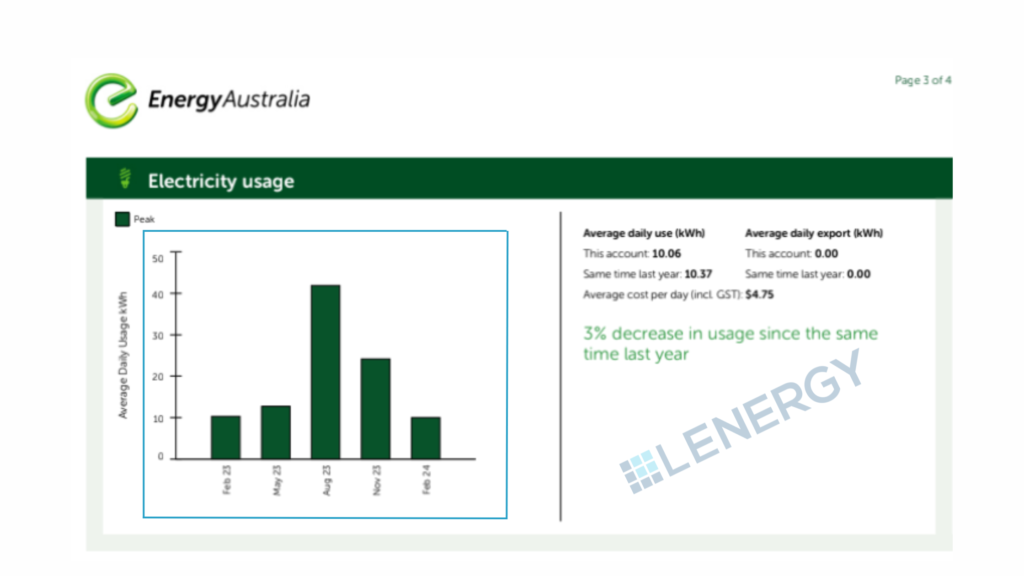
Even if your energy habits stay the same, your electricity bill probably won’t. One quarter your usage looks normal — the next, it spikes. Or maybe your solar seems to carry you through summer, but not winter. This isn’t just you — it’s the season.
Energy Use Rises in Summer and Winter
For most homes, energy use increases during extreme temperatures:
- In summer, air conditioners run longer and harder
- In winter, heaters, electric blankets, and dryers get used more often
Even if you’re being energy-conscious, these appliances are some of the most power-hungry — and they can quickly drive up your usage.
Solar Performs Better in Summer
Solar systems generate more power in summer, thanks to longer days and more sunlight hours. This often helps offset higher summer usage — especially if you use power during the day and benefit from self-consumption.
But in winter, generation drops off:
- Days are shorter
- The sun is lower in the sky
- Cloud cover is more frequent
This means your solar covers less of your usage, and you end up importing more from the grid — often just as your usage increases due to heating.
Comparing Bills Without Context Can Be Misleading
It’s easy to look at your last bill and think something’s gone wrong when it’s higher than the one before — but without checking the billing period, season, and weather, that comparison may not tell you much.
It’s more useful to compare the same season across years (e.g. winter this year vs winter last year), and to track your average daily usage, not just the total amount due.
Monthly vs Quarterly Billing — Why It Matters
If you’re only looking at the amount due on your bill, it’s easy to assume your energy usage has suddenly spiked. However, the frequency in which you are billed plays a big role in how high that number looks — and how much attention you should pay to it.
Quarterly Bills Feel Bigger
Many electricity retailers bill quarterly — every 90 or so days. That means instead of getting a $200 bill every month, you might receive a $600 bill every three months. It’s the same amount of energy, but because it’s bundled together, it feels much more confronting.
This can catch people off guard, especially during high-usage periods like summer or winter.
Monthly Billing Can Feel More Manageable — But Still Adds Up
Some retailers offer monthly billing, which spreads your costs out over time. The bills feel smaller, but the total spend across the quarter may be exactly the same — or more if your usage creeps up.
That’s why it’s important not to compare one bill to the next by dollar amount alone. Instead, look at:
- The billing period length
- Your average daily usage
- Seasonal trends (e.g. cooling or heating use)
Direct Debits Can Hide the Real Cost
If you’re on a payment plan that deducts money weekly or fortnightly, it’s even easier to lose track of what you’re spending overall. You might be paying $50 a week — but over 13 weeks, that’s $650 that has been taken off prior to how much is due on the first page of your bill.
Many households don’t realise how much they’re paying across a full quarter until they see the bill — and by then, the money’s already gone.
To stay in control, check:
- Your current usage vs last quarter
- Whether your payments are keeping pace with your usage
- If you’re in credit, or at risk of falling behind
How to Spot Problems or Overcharging
Most people assume their electricity bill is correct — but that’s not always the case. Billing systems can make mistakes, solar configurations can be set up incorrectly, and rate changes can sneak in without notice. Here’s how to check if you’re being charged more than you should be.
Check the Meter Read Type
Look for terms like:
- Actual read (based on meter data)
- Estimated read (used when your meter couldn’t be accessed)
If your bill is based on an estimate — especially after a long time between reads — it may not reflect your real usage. Check whether the next bill corrects it, or if there’s a sharp adjustment.
If you have solar and the meter read is estimated, your feed-in credits may also be inaccurate.
Compare Rates to Your Plan
Bills don’t always make it easy to see what rates you’re being charged. But check carefully:
- Are your usage rates (peak, shoulder, off-peak) what you signed up for?
- Is your feed-in tariff correct?
- Have any new fees or charges appeared?
If your provider has increased your rates, they should have notified you. It’s worth cross-checking your bill against your current plan details on the provider’s website. Feel as if you are being done badly by your energy provider? Check out another one of our articles on the best energy providers right now.

Confirm Your Solar Exports Are Being Counted
If you have solar, check that your feed-in credits appear on your bill — and that they look reasonable. Compare the export figures on your bill with what your inverter or monitoring app shows.
If your system was recently installed or upgraded, make sure the meter was reconfigured correctly. It’s not uncommon for feed-in data to be missing entirely due to administrative delays.
Look for One-Off Spikes
Sometimes, one faulty appliance (like a pool pump, old fridge, or misconfigured hot water system) can drive up your usage. If your average daily usage has suddenly jumped, ask:
- Did anything change in your home that month?
- Is the spike consistent, or isolated to certain times of day?
Your retailer’s usage graph or online portal may help you spot patterns.
Don’t Ignore Small Errors — They Add Up
Even small discrepancies in daily supply charges or controlled load rates can cost you over time. If something doesn’t look right, contact your retailer and ask for an explanation. Keep your past bills handy so you can reference historical data.
Make Your Electricity Bill Work for You
Understanding your electricity bill isn’t just about knowing what you owe — it’s about learning how your home uses energy, spotting issues early, and making smarter decisions moving forward.
Once you know how to read it properly, your bill becomes a tool — not just a headache.
Here’s what to check each billing cycle:
- Billing period — monthly or quarterly?
- Average daily usage — is it trending up or down?
- Rates — check your usage and feed-in tariffs
- Supply charges — are you paying more than one?
- Meter read type — actual or estimated?
- Solar credits — are they showing up?
- Total payments made — especially if you’re on direct debit
Your bill can tell you when your usage spikes, how well your solar is performing, and whether your current energy plan is still working for you. It can also reveal whether seasonal changes or subtle shifts in habits — like running the air con more or working from home — are having a bigger impact than expected.
Want help making sense of your bill — or figuring out how to lower it?
Send it through to us at Lenergy. We’ll take a look and help you understand exactly what’s going on, and what steps you can take to bring your costs down.